-
- November 15, 2018
- 1
Out with Outliers!

In statistics, a point that is far away from or unlike other observations is called an outlier. These observations can cause serious problems in statistical analyses by exerting undue influence on forecasts.
Let’s consider an example. In the chart below, the points are well behaved and the line showing the relationship between the X- and Y-variables is pretty much what one might expect.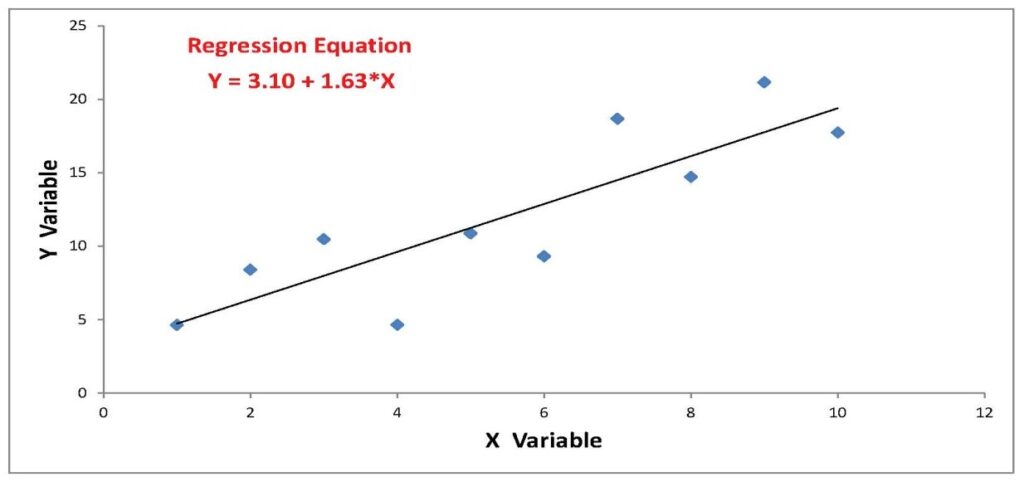
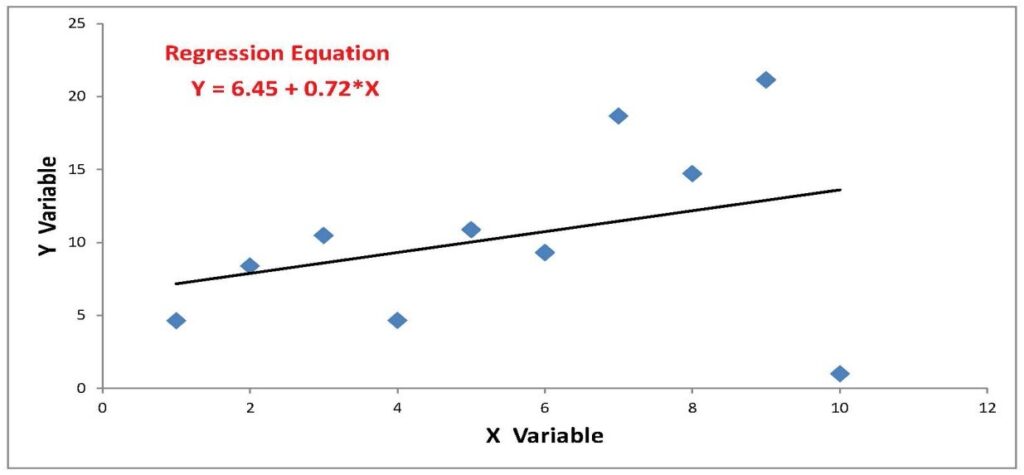
The data in the second chart below are the same with one exception: the point associated with the number 10 on the X-axis is uncharacteristically low compared to the rest of the points. The outlier point “pulled” the slope of the regression line downward. Should forecasts be based on something closer to the line above or the line below?
As is often the case, there are two competing ideas on how to deal with outliers. On the one hand, most outliers are bone fide observations. They are extreme values that are often seen in finance and economics. Arguably, they should not be discounted. On the other hand, we are always concerned that a single or series of observations can skew forecasts.
One solution is to use the median rather than the mean as a measure of central tendency. Consider the following series of figures:
2 7 11 14 16
The mean (ordinary average) is 10 and median (middle value) is 11. Now consider the same series with an outlier on the right side:
2 7 11 14 32
In this case the mean is 22, but the median is still 11. Replacing the mean with the median takes away weight from the outlier.
Other solutions to outliers
One way to deal with outliers is to kick them out. This is a great idea if we think that an observation is a data error. However, most outliers we see are less likely to be a result of an erroneous measurement, and more likely an accurate observation of a highly underrepresented market state. We do not want to remove the data point altogether. Rather, we want to be sure not to over-fit a model based on a small number of extreme values.
Winsorization is a simple and elegant way to allow us to do just that. One simple winsorization technique takes a small percentage of the highest and lowest values and changes the high figures to the lowest of the highs and the low figures to the highest of the lows. For example, if 95% of the observations in a data series fall between 30 and 70, we can change observations less than 30 to 30 and observations more than 70 to 70.
We like a slightly more complicated approach. Here’s the recipe:
- Start with a series of numbers
- Subtract the median from each of the observations
- Take the absolute value of those differences
- Calculate the average of the absolute values of the differences
- If an observation is more than three times the average, set that observation at three times the average (the actual multiplier can be chosen)
We like this so-called MAD winsorization (for mean absolute deviation) because it does not force us to change any values if the observations do not fall more than x-times the median distance away from the sample median.
Solutions at the model level
Preparing data before we run regression models is certainly useful, but it does not always solve all our problems with outliers. First of all, there is no correct answer to the question of how much we should restrict the data. An analyst’s intuition comes into play when finding a parameter that deals with obvious outliers but does not distort perfectly normal observations too much. We tend to be wary of being too proactive in changing the data. However, with a conservative approach to winsorization, we can still end up with extreme forecasts if important model indicators spike.
When something like this occurs, do we really think investors should change positions based on a single predictor’s extreme value? Probably not. We aim to build models that are as accurate as possible in explaining the historical data but also interpretable and comfortable to stick with in trying times. To accomplish this goal, sometimes we apply caps to individual predictor contributions within our models.
No blues no problem?
Statistical intuition suggests that capping predictor contributions is equivalent to changing model betas. But moving away from the ordinary least squares regression betas (and losing their best linear unbiased estimator status, or BLUE) is not quite as bad as it might seem. The key is that we are not randomly changing the betas to give us whatever signals our hearts desire. Instead, by capping the most extreme contributions, we are moving the model towards an equal weight approach. In essence, we end up with something between a linear regression model and an equal weight model. Equally weighted models in finance have long-standing tradition and so does making predictions based on sensible ensembles of models. All of this moves us towards our goal of working with useful and understandable models.
What other ways do you use to wrangle with financial data? We look forward to hearing from you.
©2018 Hull Tactical Asset Allocation, LLC (“HTAA”) is a Registered Investment Adviser.
The information set forth in HTAA’s market commentaries and writings are of a general nature and are provided solely for the use of HTAA, its clients and prospective clients. This information is not intended to be and does not constitute investment advice. These materials reflect the opinion of HTAA on the date of production and are subject to change at any time without notice. Due to various factors, including changing market conditions or tax laws, the content may no longer be reflective of current opinions or positions. Past performance does not guarantee future results. All investments are subject to risks. Where data or information is presented that was prepared by third parties, such information will be cited and any such third-party sources have been deemed to be reliable. However, HTAA does not warrant or independently verify the accuracy of such information.
LEAVE A COMMENT
What happens if you run the model only against the outliers? I am hoping this would provide an “aha”–an unexpected insight. Chances are not, but the price is cheap.