-
- October 8, 2025
- 0
The October Effect
The “October Effect” is the idea that October is the worst month for stocks. Except it isn’t an effect. It is a myth.
If we look at the longest available sample of US index returns (the Dow Jones Industrial Index) from 1896 to 2025, we find this distribution of annualized returns by month. (Source: Barchart)
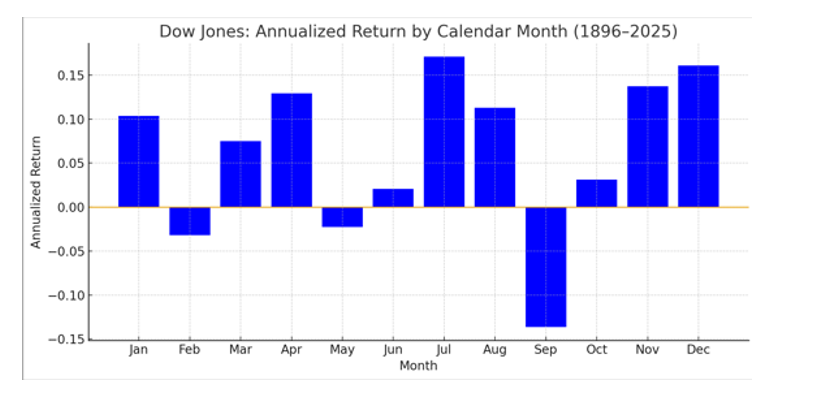
October isn’t great, but the average return is positive. February, May, June and September are all worse.
Dow, 1896–2025:
- Average October: +0.43% monthly
- Average September: –1.04% monthly
- Medians: October +0.85% vs September –0.51%
- Volatility: October 5.8% monthly; September 5.8% monthly
- Left tail (average of 5 worst months): October –17.2%, September –16.9%
Obviously, the markets have changed since 1896. No ticker tape. No prices on chalk boards. No unconscionable brokerage fees. No unconscionable spreads. Proliferation of mutual funds and indices. It is ridiculous to think that prices behaved the same way in the 19th Century as they do in the 21st Century. Many effects only exist in the old data because it was too expensive to trade them away.
If we just look at monthly returns this century, the mischaracterization of October is even more pronounced. (Source: Barchart)
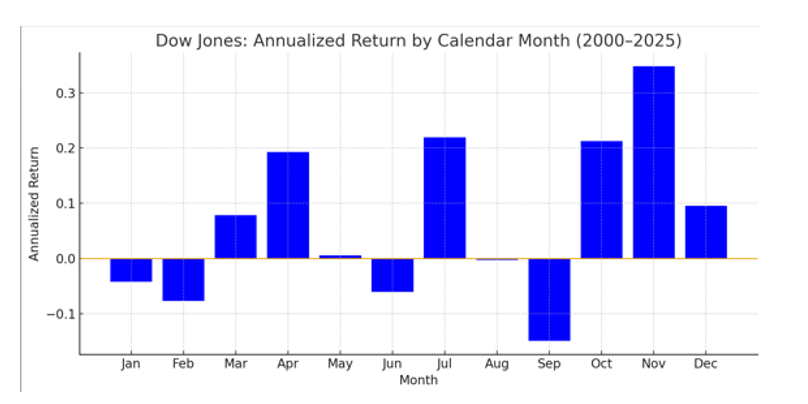
Ok – So, the data says October returns are unexceptional to decent depending on the time frame. People get things wrong all the time. Why is this interesting?
Why the myth survives:
- Availability bias. A few spectacular events happened to occur in October: 1907’s bank liquidity panic accelerated into October 1929’s crash was in October 1987’s crash and 2008’s financial crisis were also in October. These are memorable. So, they get remembered. September’s damage tends to be less theatrical and more consistent. Investors remember stories, not averages.
- Category error: tails vs. means. Saying “October is the worst” confuses “hosts some of the worst outliers” with “has the worst typical outcome.” October’s left tail is heavy; its average is not. And as long as you apply some rudimentary risk management, it is averages that matter.
- Narrative momentum. Each time an October is bad, the myth compounds. When October is fine—or strong—no one updates the story.
But here is the real takeaway: calendar effects don’t exist. What looks like something tied to the calendar is really a manifestation of some flow that happens to take place at that time. The end-of-the-month effect is really the mutual-fund-rebalancing effect. The January effect is really the tax-loss-harvesting-rebound effect. Nothing special always happens in October. The big crashes just happened to take place then. They could have happened in any month. Covid wasn’t in October. The tariff moves weren’t in October. The dot-com crash wasn’t in October. October isn’t special.
The myth is tidy. It gives you something to do (“be careful in October!”) that feels prudent without the work of investigating why markets are fragile. The real drivers of ugly months aren’t months—they’re funding stress, positioning, macro shocks, and forced flows. Those can show up in March just as well as October. A calendar is not a risk model.
Disclaimer
This document does not constitute advice or a recommendation or offer to sell or a solicitation to deal in any security or financial product. It is provided for information purposes only and on the understanding that the recipient has sufficient knowledge and experience to be able to understand and make their own evaluation of the proposals and services described herein, any risks associated therewith and any related legal, tax, accounting, or other material considerations. To the extent that the reader has any questions regarding the applicability of any specific issue discussed above to their specific portfolio or situation, prospective investors are encouraged to contact HTAA or consult with the professional advisor of their choosing.
Except where otherwise indicated, the information contained in this article is based on matters as they exist as of the date of preparation of such material and not as of the date of distribution of any future date. Recipients should not rely on this material in making any future investment decision.
The Dow Jones Industrial Average (DJIA) is composed of 30 “blue-chip” U.S. stocks and is the oldest continuous barometer of the U.S. stock market, and the most widely quoted indicator of U.S. stock market activity. The DJIA is a price weighted index of 30 component common stocks.
Certain information contained herein constitutes “forward-looking statements,” which can be identified by the use of forward-looking terminology such as “may,” “will,” “should,” “expect,” “anticipate,” “project,” “estimate,” “intend,” “continue,” or “believe,” or the negatives thereof or other variations thereon or comparable terminology. Due to various risks and uncertainties, actual events, results or actual performance may differ materially from those reflected or contemplated in such forward-looking statements. Nothing contained herein may be relied upon as a guarantee, promise, assurance or a representation as to the future.
LEAVE A COMMENT