-
- November 12, 2020
- 0
The Halloween Effect: A Persistent Anomaly

The idea of “sell in May and go away” isn’t new. Sometimes called the Halloween effect, the fact that equity markets do better in the winter months is one of the most well tested in finance. The effect is persistent, large and statistically significant. This is valuable information for investors. Even better is that a lot of people don’t believe in the effect. This means it has a good chance of continuing to hold.
For example, in “Why Sell in May Doesn’t Work” Bernard Condon of The Huffington Post (April 30th, 2012) admits that the math has been compelling and that summer markets have under-performed winter markets . But then he goes on to say the idea has no predictive power because the returns are too volatile and averages don’t tell the whole story.
Ken Fisher derided the idea of winter out-performance in his book, “Debunkery”. He specifically gives the example of September. While September has averaged a 0.72% decline since 1926, the month has also been exceedingly volatile. Fisher says if you remove just two of the worst Septembers, stocks break even for the
month.Each of these objections is based on the idea that monthly returns are very noisy and dominated by one or two extreme results, so averages are misleading. This is actually fairly easy to test. So let’s look at the numbers.
We will look at the S&P 500 returns (including dividends) from the start of 1950 until the end of October 2020. Let’s see what happens if we invest $100 just over summers (May to October) and winters ( November to April).
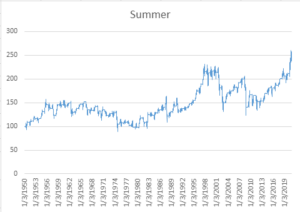
Figure One: The value of $100 invested during summer in the S&P 500 from 1950 to 2020.
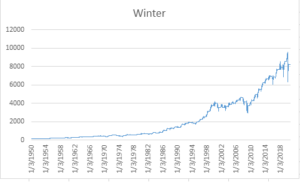
Figure Two: The value of $100 invested during winter in the S&P 500 from 1950 to 2020.
Graphs can’t replace statistics, but in this case the visual evidence is overwhelming. Table One shows the summary statistics for each season. Winter has higher returns and lower volatility.
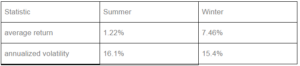
Removing the five best and worst seasons (to address Ken fisher’s concerns) does nothing to change our conclusion.
But it is possible that we are just data mining. To help reduce this possibility we can look at other time periods and other markets. Ben Jacobsen and Cherry Zhang examined monthly stock returns from 108 different markets going back as far as 1693 for the UK. So this anomaly that has persisted for 327 years.
Specifically, across all of the markets they studied the average difference between the returns from November to April (the coldest northern hemisphere months) and the returns from May to October are 4.52%.
The effect is also unusually ubiquitous. Unlike most other calendar anomalies (e.g. the January effect), selling in May works in emerging markets and frontier markets as well as developed markets.
So at least the markets seem to like the colder weather.
LEAVE A COMMENT